
背景
我大学自学了Linux,毕业后也一直在从事OPS相关的工作;虽然现在在做安全相关的工作,可是业余时间,我特别喜欢Self Hosting,这也让我离不开OPS。
在过去的工作中,做得更多的是Automation相关的,而对于Performance没有过多的关注,这也是我一直以来的心病;然而最近在学习eBPF,看到了Brendan Gregg大佬的博客,仿佛又听到了Performance对于我的召唤。所以,我决定要补作业,好好学习一下Linux Performance。
注意事项
- 本页面不定时更新
- 该文章采用自上而下的方式组织内容,更多的是学习总结。
- 水平有限,内容可能有错。
- 部分内容直接翻译自参考文章。
简介
从计算机诞生,互联网不断地发展壮大,软件正在吞噬世界,软件的重要性越来越凸显。而软件的质量问题始终无法解决,在软件工程中,Bug和Performance Issue是影响软件健康的两大问题。Bug是软件的瑕疵,是客观存在的事实,而Performance Issue是主观的。
Linux性能分析很复杂,涉及到计算机系统的方方面面,尤其随着云计算的兴起,计算环境越来越复杂,软件性能的影响因素也随之增多,如何在复杂的环境中发现性能瓶颈是一个问题。
Linux性能分析需要很强的Debug能力,涉及到操作系统,内核,文件系统,网络和软件等多个方面;在分析的过程中,我们要了解到每个部分的执行时间,为什么有的地方耗时特别长,然后对其进行优化。
发现性能瓶颈并进行优化的过程叫做Tune。
几个问题
在我们开始学习之前,我们按照“What,Why,How”的模式问自己几个问题:
-
什么是Linux Performance?
Linux Performance研究的是如何提高软硬件利用率,解决软硬件性能瓶颈问题。
-
为什么要研究Linux Performance?
减少硬件开支,提升软件性能,优化用户体验。
-
如何学习Linux Performance?
- 学习资料:没有机会接触真实的生产环境,是很难经常遇到性能问题的。学习的渠道有很多,在这里,我推荐通过Brendan Gregg大佬的博客学习,博客上内容很丰富,内容质量极高。
- 实践:找一台跑着大量服务的服务器,上手分析。
收集资料
之前,我都是通过Google搜索到一些零散的资料,难以系统性学习;最近我把Brendan Gregg大佬的博客翻了一遍,感觉如果把博客上所有内容学习一遍,那么在Linux方面的内功一定会突飞猛进。本来我想买大佬的《Systems Performance: Enterprise and the Cloud, 2nd Edition (2020)》,但是美国的书也太贵了,买不起啊,最后决定自己整理一批资料,进行深度学习。
建议按照以下顺序阅读:
- Linux Load Averages: Solving the Mystery
- Linux Performance Analysis in 60,000 Milliseconds
- 30 Linux System Monitoring Tools Every SysAdmin Should Know
- The USE Method
- USE Method: Linux Performance Checklist
- Linux Performance Tools Mindmap
- Brendan Gregg Blog
其他辅助阅读资料:
Linux Architecture
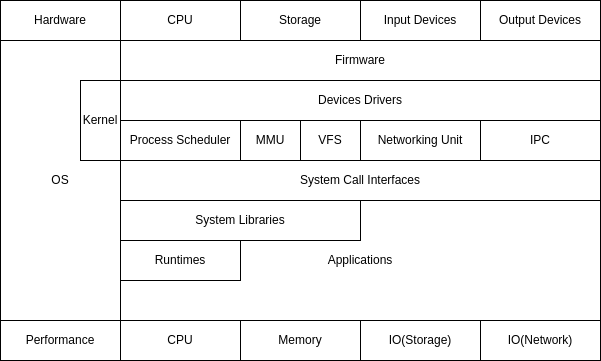
在分析Linux性能之前,我们最好能理解Linux架构,这样才能明白具体哪里出了问题。
下图是我自己的理解,仅供参考。
概念
Metrics-性能指标
我们评判Linux Performance,需要有一些测量方法和指标,常见的指标(Metrics)包括:
- Load Average
- CPU Load Average
- System Load Average
- IO
- Disk IO
- File System IO
- Network IO
Latency(延迟/延时)
从客户的角度来看,性能问题具体体现在延迟上,比如:客户访问一个网站,等待了3秒钟,网页内容才展示出来。
测量延迟的指标是时间。对于人类来说,可感知的时间单位为秒,对于计算机来说,时间可以精确到纳秒。我们必须要从计算机的角度理解时间,这样才能判断在哪个地方,耗时比较长,进而进行优化。
参考以下资料:
- Napkin Math
- Approximate cost to access various caches and main memory?
- Latency Numbers Every Programmer Should Know
Load Average
涉及到性能问题时,我们经常会听到Load Average这个词(平均负载),大家都知道通过top/htop之类的命令可以查看,三个数字分别代表过去1/5/15分钟的平均负载,但是平均负载到底是什么呢?
我在Linux Load Averages: Solving the Mystery找到了答案,[RFC 546 TENEX Load Averages for July 1973]中给出了定义:
[1] The TENEX load average is a measure of CPU demand. The load average is an average of the number of runable processes over a given time period. For example, an hourly load average of 10 would mean that (for a single CPU system) at any time during that hour one could expect to see 1 process running and 9 others ready to run (i.e., not blocked for I/O) waiting for the CPU.
注:Tenex是1969年为PDP-10开发的操作系统。
平均负载是一段时间内,可运行的进程数量的平均值。例如,对于单CPU系统来说,“每小时平均负载10”意味着,该系统有1个运行的进程,以及9个等待运行的进程。
另外,可以参考Linux中关于Load Average的代码:
但是,Linux后来修改了Load Average的计算方式,现在Load Average不仅反映了Runnable Tasks,而且也包括了Uninterruptible Tasks,所以磁盘IO也会影响Load Average的值;所以Load Average不再是CPU Load Average了,而是变成了System Load Average。
Brendan Gregg在邮件存档中找到了一封邮件,并联系到了修改相关代码的作者Matthias,Matthias对于当初的修改有如下想法:
“The point of “load average” is to arrive at a number relating how busy the system is from a human point of view. TASK_UNINTERRUPTIBLE means (meant?) that the process is waiting for something like a disk read which contributes to system load. A heavily disk-bound system might be extremely sluggish but only have a TASK_RUNNING average of 0.1, which doesn’t help anybody.”
Load Average和IO都是非常容易让人误解的词汇,Load Average到底是CPU Load Average,还是System Load Average?IO到底是Disk IO,还是File System IO,或者是Network IO?
最后以Scheduler维护者在kernel/sched/loadavg.c中的注释来结束该段内容:
This file contains the magic bits required to compute the global loadavg figure. Its a silly number but people think its important. We go through great pains to make it work on big machines and tickless kernels.
CPU
CPU(中央处理器)是直接插到计算机主板上的芯片,有两种架构:单核和多核,现代CPU一般都是多核的,并且带有超线程技术。比如,我们说4核8线程,说明该CPU有4个核心,每个核心有两个硬件线程,所以在操作系统上会显示8个逻辑核心。
在Linux上执行cat /proc/cpuinfo ,有如下输出,cpu cores 是CPU的核心总数,core id 是核心的id,processor 是逻辑CPU的id,你会发现processor 6和7的core id 都是3
下表列出了top 命令中CPU统计的指标含义。
| CPU States | 含义 |
|---|---|
| us/user | User Space时间 |
| sy/system | Kernel Space时间 |
| ni/nice | niced user processes时间 |
| id/idle | 空闲时间 |
| wa/IO-wait | IO等待时间 |
| hi/Hardware Interrupt | 硬件中断时间 |
| si/Software Interrupt | 软件中断时间 |
| st/Stolen | 虚拟机占用时间 |
Memory
在free/top/htop里,内存由如下部分组成:
| 内存名称 | 实际含义 |
|---|---|
| total | 内存总量 |
| used = total - free - buffers - cache | 被操作系统和应用使用的总量 |
| free | 未使用的内存 |
| shared | 大部分为tmpfs使用空间 |
| buffer | kernel buffer |
| cache | page cache |
| buff/cache | buffers + cache |
| available = free + buffers + cache | 可利用的内存,包括page cache |
关于内存的知识,可以查看该网站Linux ate my ram!和Experiments and fun with the Linux disk cache;关于buffer和cache的区别,可以参考commit和Linux Memory: Buffer vs Cache。
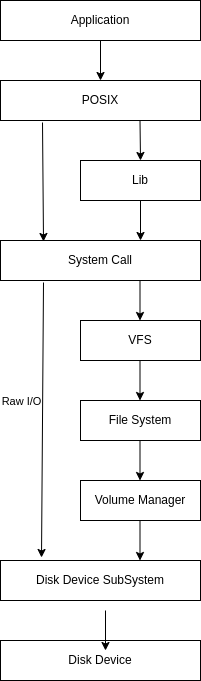
File System
下图是Linux I/O的调用栈。
Disk
Network
Process/Thread
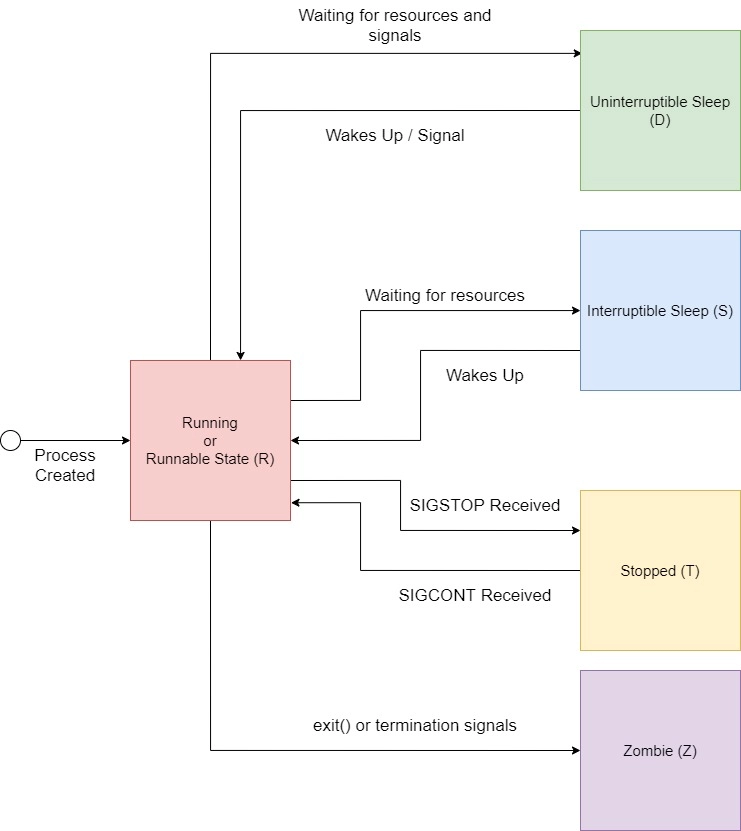
| 进程状态 | 说明 |
|---|---|
| R | Running or Runnable |
| D | Uninterruptible Sleep |
| S | Interruptable Sleep |
| T | Stopped |
| Z | Zombie |
软件包
- BCC
- bpftrace
- procps-ng/htop
- sysstat
- DTrace
- SystemTap
- perf
工具
| 名称 | 说明 |
|---|---|
| top/htop | top及变种htop显示CPU和内存信息,包括系统级别和进程级别;该工具缺点是本身会占用较多的CPU开销 |
| mpstat/vmstat/iostat/netstat | 分别显示CPU/Memory/IO/Network信息 |
| iotop/iftop | 输出IO和网络流量的吞吐量 |
| sar/perf | 综合工具 |
| docker stats | 显示容器的信息 |
| vnstat | 其他:网络流量统计 |
| ps | 显示进程信息 |
|
|
数据源
Profiling需要数据,才能输出结果,那么这些数据来自哪里呢?
| 数据类型 | 来源 |
|---|---|
| 进程级计数器 | /proc |
| 系统级计数器 | /proc,/sys |
| 设备驱动和调试信息 | /sys |
| 进程级跟踪 | ptrace,uprobes |
| 性能计数器 | perf_event |
| 网络跟踪 | libpcap |
| 进程级延时指标 | 延时核算 |
| 系统级跟踪 | tracepoints,kprobes,ftrace |
分析方法
基本方法
The USE Method
USE是指Utilization(使用率),Saturation(饱和率)和Errors(错误),该方法是Brendan Gregg大佬开发的方法,内容如下:
The Utilization Saturation and Errors (USE) Method is a methodology for analyzing the performance of any system. It directs the construction of a checklist, which for server analysis can be used for quickly identifying resource bottlenecks or errors. It begins by posing questions, and then seeks answers, instead of beginning with given metrics (partial answers) and trying to work backwards.
该方法通过列出一个Checklist,通过“问问题,给出答案”的方式,而不是通过metrics去判断。
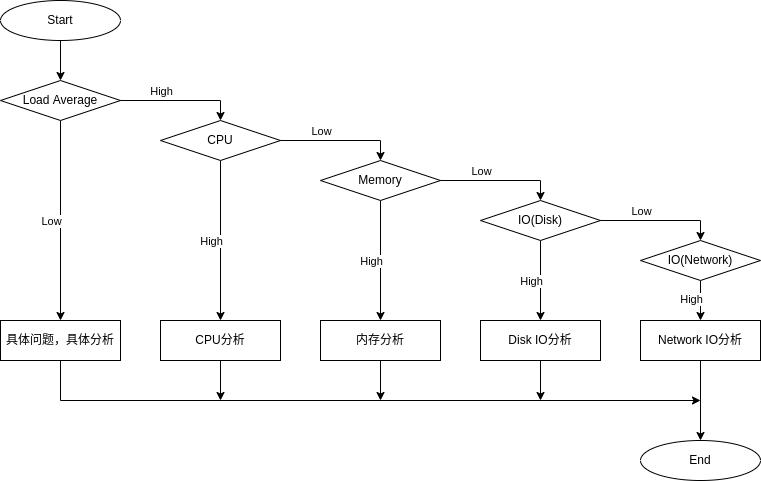
分析
问题清单
在开始具体的分析之前,我们要找到真实的故障点,而不是你认为的故障点(一拍脑门的假设)。
- 首先,我们要有一个问题的精确描述,比如
- 出现问题多久了?
- 具体的故障表现是什么?
- 最近有什么人为变动吗?
- 然后,根据以上问题的答案,做出假设,对假设一一排除
CPU
Memory
DIsk IO
Network IO
从网络层面分析性能问题,可以按照ISO/OSI网络模型来分析,需要考虑以下几点:
- 网络出口带宽是否够用
- 内网带宽是否小于出口带宽
- 路由器路由策略(网络工程师考虑)
- 传输层TCP/UDP问题,Linux上相关的sysctl参数调优
应用程序
如果最后问题定位到了具体的应用程序,我们可以从以下方面分析:
- 程序的off-CPU时间在干嘛
- 系统调用
- 算法复杂度
基准测试
实验
-
观察内存变化的三种方式
-
读取大量的文件,观察
free和cache的变化 -
丢掉内存中的缓存,然后使用
free -h查看buff/cache的大小 -
观察内存消耗和OOM
复制下列代码到
munch.c,该代码会不断消耗内存,然后被oom-killer杀死。1 2 3 4 5 6 7 8 9 10 11 12 13 14 15 16 17 18 19 20#include <stdlib.h> #include <stdio.h> #include <string.h> int main(int argc, char** argv) { int max = -1; int mb = 0; char* buffer; if(argc > 1) max = atoi(argv[1]); while((buffer=malloc(1024*1024)) != NULL && mb != max) { memset(buffer, 0, 1024*1024); mb++; printf("Allocated %d MB\n", mb); } return 0; }执行下列命令:
对比运行
munch运行前后free的输出,观察有什么变化。 -
观察
cache对于Java和Python应用性能的影响,观察清除cache后第一次和第二次,Java和Python程序的运行时间对比(Java和Python运行需要runtime,cache会提高性能)1 2 3 4 5 6 7 8 9 10 11 12 13 14 15 16 17 18 19 20 21 22 23 24 25 26 27 28 29 30 31 32 33 34 35 36 37 38 39 40 41 42 43 44 45 46 47 48 49$ cat hello.py print("Hello World! Love, Python") $ cat Hello.java class Hello { public static void main(String[] args) throws Exception { System.out.println("Hello World! Regards, Java"); } } $ javac Hello.java $ python hello.py Hello World! Love, Python $ java Hello Hello World! Regards, Java # 清除cache之后第一次运行 $ echo 3 | sudo tee /proc/sys/vm/drop_caches $ time python hello.py Hello World! Love, Python real 0m1.026s user 0m0.020s sys 0m0.020s $ time java Hello Hello World! Regards, Java real 0m2.174s user 0m0.100s sys 0m0.056s # 清除cache之后第二次运行 $ time python hello.py Hello World! Love, Python real 0m0.022s user 0m0.016s sys 0m0.008s $ time java Hello Hello World! Regards, Java real 0m0.139s user 0m0.060s sys 0m0.028s
总结
Linux性能分析是一门非常复杂的学问,涉及到硬件,操作系统,内核,软件,网络以及其他知识。如果你不理解Load Average,进程,TCP连接,虚拟内存等概念,就很难理解性能问题。
分析性能问题的主要判断依据是数据,工具从内核或者其他地方收集数据,进行分析后,输出到显示器,我们结合概念和数据,对问题做出判断。
附录
面试题
-
在真实的生产环境中,系统的平均负载应该保持在什么水平?
视具体情况,应该设定一个阀值,考虑到应用的突发情况。
对于只有一个CPU的服务器,系统1分钟内的平均负载为0.7,并不完全意味着没有性能问题,可能其中一个时间段,有性能突发的问题。
-
一台服务器Load Average非常高,但是CPU使用率特别低,可能是什么原因?
-
一台服务器无法通过SSH连接,可能是什么问题?
术语表
| 术语 | 解释 |
|---|---|
| Clock Rate | 时钟频率 |
| CPU bound | CPU密集型 |
| I/O bound | I/O密集型 |
| Tuning | 调优 |
| Profiling | 剖析 |
| Latency | 延迟 |
| Response Time | 响应时间 |
| Buffer/Cache | 写/读缓存 |
| SuperBlock | 超级快(描述文件系统的数据结构) |
| dentry | 文件路径中所有的元素,比如/bin/bash中“/”和“bin”都是dentry |
| inode | 描述文件的元数据 |